
Interactive dashboards for sales, operations, productivity, finance, and management reporting.
Many operations teams and SMEs find themselves buried in daily reporting admin—downloading CSV sheets from CRMs, matching them with VLOOKUPs, and building charts by hand. Our custom Power BI dashboards eliminate this manual overhead. We connect directly to your local file servers, database servers, or cloud APIs, pulling your data into a single, cohesive reporting model that updates automatically.
We model your metrics using professional DAX calculations and clean relationships. This means you don't just see a static table; you can filter by team leader, drill down into regional margin leaks, and isolate shipping cost spikes with one click. We ensure all calculations are fully optimized so your reports load instantly.
Once built, we handle the complete handover of the raw `.pbix` templates. We train your operations staff to manage the workspace, edit report connections, and run gateway schedulers, ensuring you maintain complete administrative control without being locked into recurring developer support contracts.
Click on any dashboard to open the live interactive Power BI demo. Explore the charts, filters, and reports directly.
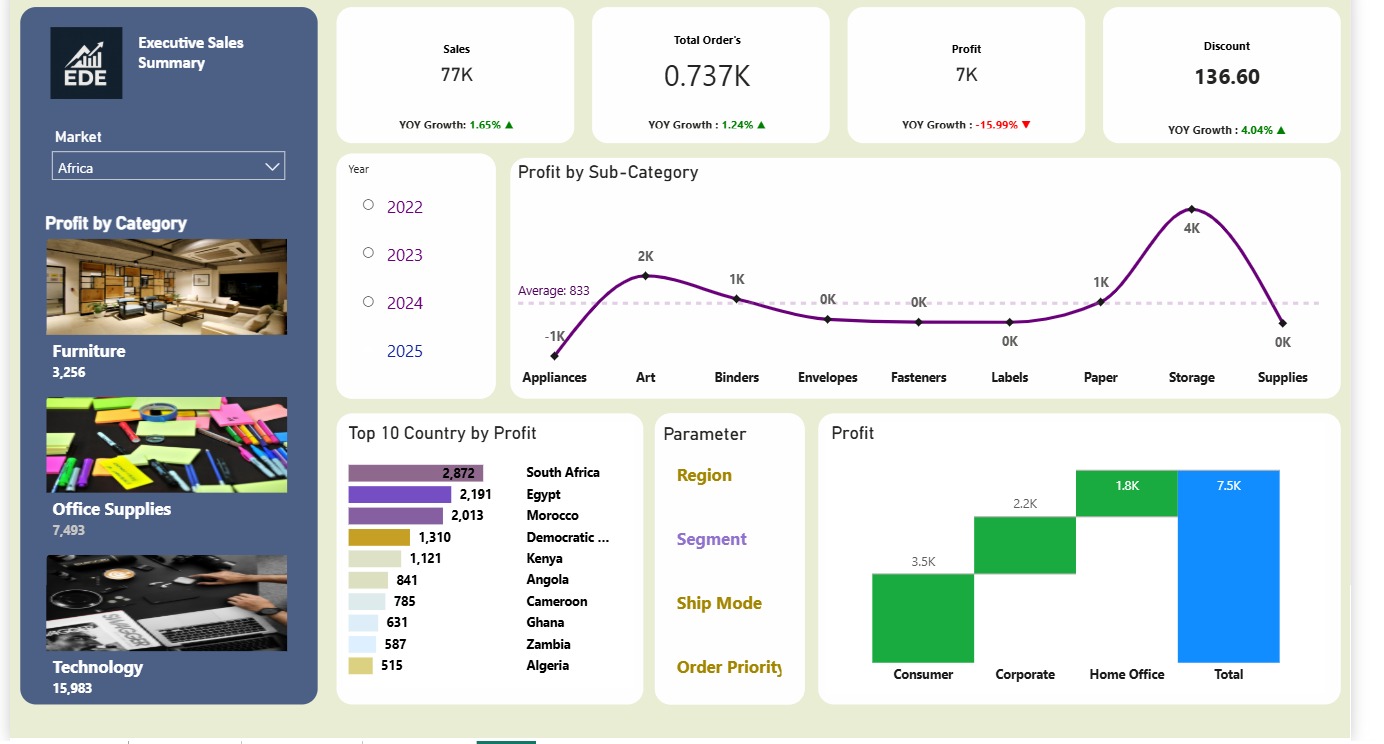
The Problem: Manual sales reporting from multiple store locations was slow, prone to errors, and prevented leadership from seeing weekly profit margins. Operations managers spent days compiling CSV files.
What We Built: An interactive, consolidated sales performance dashboard in Power BI. We built automated data flows from store POS files and designed intuitive slicers for filtering by region, category, and date range.
The Result: Reduced report compilation time from X hours per week to Y minutes, giving executive leadership same-day visibility on sales margins.
Launch Interactive Demo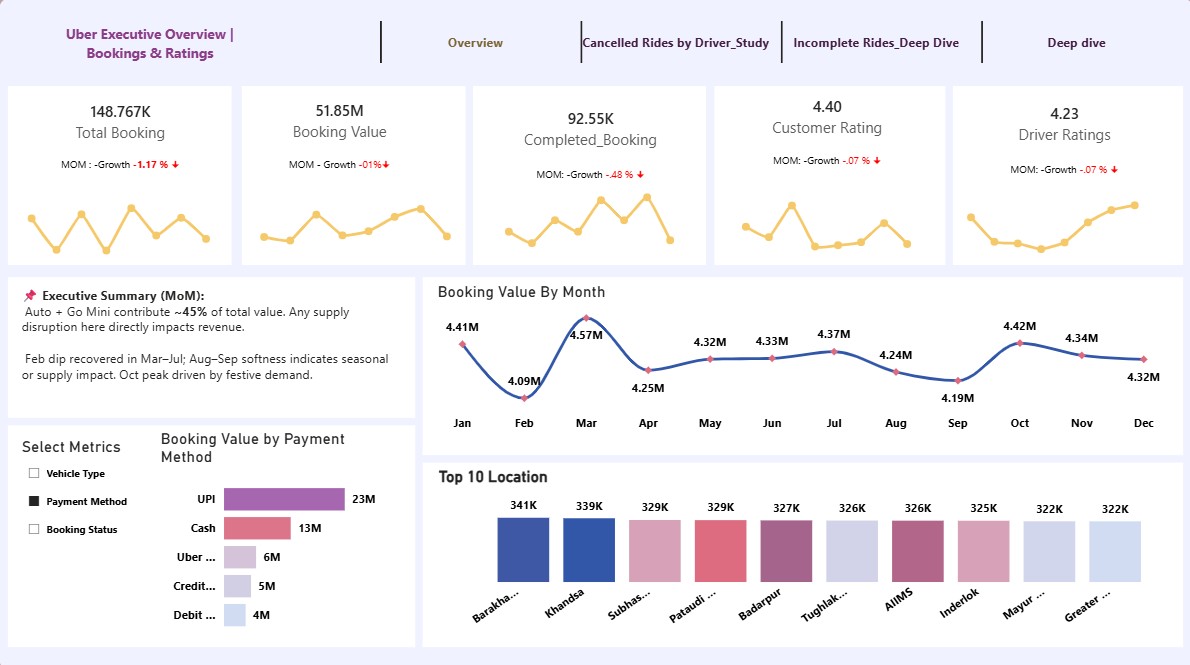
The Problem: Operational logs from fleet tracking databases and trip databases were disconnected. Fleet managers could not track real-time vehicle downtime, cancelled trip rates, or individual driver metrics in one place.
What We Built: A centralized operations and fleet performance dashboard. The tool consolidates driver shifts, active vehicle logs, and trip schedules to highlight cancellations and idle capacity.
The Result: Cut fleet operations check-in times from X minutes down to Y minutes per shift, enabling dispatch teams to identify idle drivers in real time.
Launch Interactive DemoLet our team build a tailored dashboard system that auto-refreshes your key business data.